Heikin Ashi chart
Heikin Ashi chart is a type of candlestick chart used in technical analysis to identify trends and predict future price movements. Heikin Ashi is a Japanese term that means "average bar" or "average pace".
The Heikin Ashi chart is different from a regular candlestick chart in the way it is constructed. In a regular candlestick chart, each candlestick represents the open, high, low, and close prices for a specific time period. However, in a Heikin Ashi chart, the candlesticks are calculated using a modified formula based on the average price of the asset.
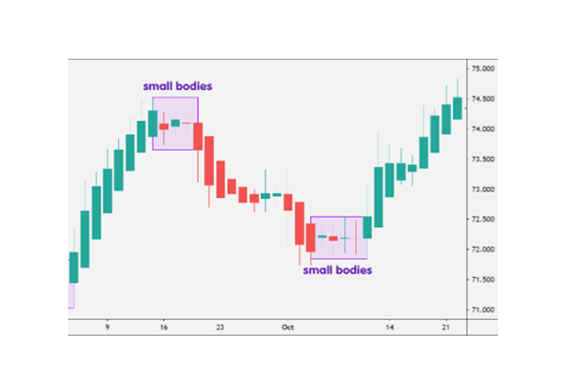
The resulting Heikin Ashi candlesticks tend to be smoother and less volatile than regular candlesticks, which can help to filter out market noise and provide a clearer picture of trends. Heikin Ashi charts can be used to identify trends, support and resistance levels, and potential reversal points in the market.
Advantages:
1. Smooths out market noise: The modified formula used to calculate Heikin Ashi candlesticks tends to create smoother and less volatile charts, which can help to filter out market noise and provide a clearer picture of trends.
2. Helps identify trends: Heikin Ashi charts can be useful for identifying trends in the market, as the candlesticks tend to be more reflective of the underlying price action.
3. Provides clearer signals: The modified candlesticks in a Heikin Ashi chart can help to provide clearer signals for traders, making it easier to identify potential support and resistance levels, as well as potential reversal points.
Disadvantages:
1. Less information on price movements: Because Heikin Ashi charts are based on a modified formula, they provide less information on price movements than regular candlestick charts. This can limit the information available to a trader and potentially miss important price movements.
2. Delayed signals: Heikin Ashi charts can sometimes provide delayed signals compared to regular candlestick charts, which can make it more difficult for traders to enter or exit a trade at the optimal time.
3. Not suitable for all trading styles: Heikin Ashi charts may not be suitable for all trading styles, particularly those that rely on more detailed information about price movements.
In summary, Heikin Ashi charts can be a useful tool for identifying trends and providing clearer signals for traders. However, they may provide less information on price movements and can sometimes provide delayed signals. Traders should consider their individual needs and preferences when choosing a chart type to use in technical analysis.